• Our booking engine at tickets.railforums.co.uk (powered by TrainSplit) helps support the running of the forum with every ticket purchase! Find out more and ask any questions/give us feedback in this thread!

Calculating Railway Height

Andy873

Member
Joined
23 Mar 2017
Messages
965
I have for a long time now been trying to both confirm some station heights and the heights of two junctions, not easy when both the stations and the line have long since gone.

Normally, I view the 1909 OS map, but yesterday I had a look at some older town map from the 1890's, whilst these only cover towns or part of a town they show much more detail. On them I noticed many BM's (Bench Marks) and decided to have a little read about them. There were half a million of them all around the country at one time.

All of these bench marks state the height above the OD (Ordnance Datum) which is measured at zero feet at Newlyn Harbour in Cornwall. All bench marks have an arrow symbol shown on maps.

Let's take an example: B.M. 277.5

The value 277 from an 1890's map means that location point is 277 feet above Newlyn Harbour.

I decided to check John Marshall's profile gradient for my old branch line and his station heights correspond with the BM heights. He has Padiham station at 272 feet. Looking along the track area through the station, heights vary only slightly from 271.4 to 271.8, so for me 272 is good enough.

Using these bench marks and corresponding spot heights from the older town maps for me is the answer.

I wondered (as Padiham station was above road level) just how high up it was, looking at one photo in particular I guessed about 20 feet above, but was I close? Following the tracks East out of the station they cross over Station Road via two parallel bridges, and between the bridges (at road level) it states a height of 254.0, the track level says 271.something which gives a difference of 17 feet. The bench mark actually on the platform gives 277.50 a difference of 23 feet. Take off the height of the platform and we get to something like 20 feet - so it was a reasonable guess.

Using these older town maps, understanding what bench marks are telling you, you can get to some reasonable height details. I was able to confirm Great Harwood Junction (Blackburn) was 406 feet, something that John didn't make a note of, and Padiham Junction (Rose Grove West) is around 450 feet although there is a lack of bench marks for this one.

You can have a look at this example here:
NLS Padiham 1890

I hope this is a little clearer than mud! and it may help some of you find those heights.

One question though: If a BM has a height of say 271.8 - what is the .8? eight inches? a percentage of a foot?
 
Sponsor Post - registered members do not see these adverts; click here to register, or click here to log in
R

RailUK Forums

edwin_m

Veteran Member
Joined
21 Apr 2013
Messages
24,935
Location
Nottingham
I found this website with a huge number of photographs from the 1950s, of Ordnance Survey people taking photos of spot heights around Manchester, presumably so future OS people could locate them. They are indexed by grid square but not within the square, but if you view a square with railways it turns out quite a lot of railway features appear. This include the only photo I've seen of the coal emptying apparatus at Hartshead power station, which I remember seeing in dereliction in the mid-70s.


norbitonflyer

Established Member
Joined
24 Mar 2020
Messages
2,424
Location
SW London
I have for a long time now been trying to both confirm some station heights and the heights of two junctions, not easy when both the stations and the line have long since gone.

Normally, I view the 1909 OS map, but yesterday I had a look at some older town map from the 1890's, whilst these only cover towns or part of a town they show much more detail. On them I noticed many BM's (Bench Marks) and decided to have a little read about them. There were half a million of them all around the country at one time.

All of these bench marks state the height above the OD (Ordnance Datum) which is measured at zero feet at Newlyn Harbour in Cornwall. All bench marks have an arrow symbol shown on maps.

Let's take an example: B.M. 277.5

The value 277 from an 1890's map means that location point is 277 feet above Newlyn Harbour.

I decided to check John Marshall's profile gradient for my old branch line and his station heights correspond with the BM heights. He has Padiham station at 272 feet. Looking along the track area through the station, heights vary only slightly from 271.4 to 271.8, so for me 272 is good enough.

Using these bench marks and corresponding spot heights from the older town maps for me is the answer.

I wondered (as Padiham station was above road level) just how high up it was, looking at one photo in particular I guessed about 20 feet above, but was I close? Following the tracks East out of the station they cross over Station Road via two parallel bridges, and between the bridges (at road level) it states a height of 254.0, the track level says 271.something which gives a difference of 17 feet. The bench mark actually on the platform gives 277.50 a difference of 23 feet. Take off the height of the platform and we get to something like 20 feet - so it was a reasonable guess.

Using these older town maps, understanding what bench marks are telling you, you can get to some reasonable height details. I was able to confirm Great Harwood Junction (Blackburn) was 406 feet, something that John didn't make a note of, and Padiham Junction (Rose Grove West) is around 450 feet although there is a lack of bench marks for this one.

You can have a look at this example here:
NLS Padiham 1890

I hope this is a little clearer than mud! and it may help some of you find those heights.

One question though: If a BM has a height of say 271.8 - what is the .8? eight inches? a percentage of a foot?
Note that the bench marks are usually etched into the side of a building, usually at about waist height, so they will be a few feet higher than the ground, especially if the buiding is itself on a platform.
R.92af7021b7333f049b17d0c28e109887
 

Andy873

Member
Joined
23 Mar 2017
Messages
965
are there any with 2 figures after the "." and if so, are they just 10s and 11s?
I had a look around and yes, one has .48 and one has .50?? Looking at modern examples the initial value is meters and after the dot it's milometers, but these 1890's map are imperial measurements. There's only 12 inches per foot so it can't be inches, what else could it be?
 

John Webb

Established Member
Joined
5 Jun 2010
Messages
3,076
Location
St Albans
I had a look around and yes, one has .48 and one has .50?? Looking at modern examples the initial value is meters and after the dot it's milometers, but these 1890's map are imperial measurements. There's only 12 inches per foot so it can't be inches, what else could it be?
Decimals of a foot, I understand.
 

John Webb

Established Member
Joined
5 Jun 2010
Messages
3,076
Location
St Albans
Thanks John, looks like your right. Each foot was divided into a hundred. One hundredth of a foot was 1/8 of an inch or so I've just read.

That conversion to 1/8th inch is approximate as there are 96 eighths of an inch in a foot. (12 x 8=96). All levelling was done by the OS in feet and decimals of a foot for ease of calculation rather than introduce foot to inch conversions to make things more complex!
 

Andy873

Member
Joined
23 Mar 2017
Messages
965
That conversion to 1/8th inch is approximate as there are 96 eighths of an inch in a foot. (12 x 8=96). All levelling was done by the OS in feet and decimals of a foot for ease of calculation rather than introduce foot to inch conversions to make things more complex!
Thanks once more John and all.

I was just curious about rounding up or down to the nearest foot, and the nearest foot is close enough for me! So I would say a value of .48 we can round up, less than that round down.

One thing I have found out is that the goods yards at Padiham and Great Harwood were lower than the main running lines. Padiham by 3 feet, Great Harwood 4 feet. This means any runaway vehicles in the goods yards would have to run uphill, a good safety precaution and something that has not be noted before on this line at least.

Note that the bench marks are usually etched into the side of a building, usually at about waist height, so they will be a few feet higher than the ground, especially if the buiding is itself on a platform.
R.92af7021b7333f049b17d0c28e109887
Yes, I agree, on the wall of the platform it says 277. take off what? 3 feet, that makes 274, minus the road level at 254 makes the platforms 20 feet or so above road level.
 
Last edited:

John Webb

Established Member
Joined
5 Jun 2010
Messages
3,076
Location
St Albans
Thanks once more John and all.

I was just curious about rounding up or down to the nearest foot, and the nearest foot is close enough for me! So I would say a value of .48 we can round up, less than that round down.....
The scientific convention is that 277.48 would be rounded down to 277; 277.52 would be rounded up to 278. On the other hand 277.5 is rounded up to 278, the nearest even number; not quite certain where that convention came from - my maths masters never explained it 60+ years ago and I never thought to ask the physics master at the time....
 

norbitonflyer

Established Member
Joined
24 Mar 2020
Messages
2,424
Location
SW London
The scientific convention is that 277.48 would be rounded down to 277; 277.52 would be rounded up to 278. On the other hand 277.5 is rounded up to 278, the nearest even number; not quite certain where that convention came from - my maths masters never explained it 60+ years ago and I never thought to ask the physics master at the time....
I never quite followed it either, except that if you truncate a number (rather than round it) and the last remaining digit is 5 (e.g 277.500000001 truncated to 277.5) it should obviously be rounded up to 278, not down. (whereas 277.49999999999 would be truncated to 277.4 and therefore shoiuld be rounded to 277)
 

edwin_m

Veteran Member
Joined
21 Apr 2013
Messages
24,935
Location
Nottingham
I never quite followed it either, except that if you truncate a number (rather than round it) and the last remaining digit is 5 (e.g 277.500000001 truncated to 277.5) it should obviously be rounded up to 278, not down. (whereas 277.49999999999 would be truncated to 277.4 and therefore shoiuld be rounded to 277)
Rounding to the nearest even number means that a the average of a set of numbers will be affected less by the rounding. The alternative is always to round up the .5 numbers, but that means (assuming the numbers are distributed randomly) that more will be rounded up than down.
 

stuving

Member
Joined
26 Jan 2017
Messages
267
I've actually never come across this, as it just wasn't a thing in the 60s when I was at school or university. Later I did have to address the same issues in designing sampling or digitisation strategies (strictly it's discretisation). The rule is different only in that it's a simpler version, meant for manual use.

The specific point of the rule is to avoid adding a bias to the mean of the values (or their distribution). The obvious (to me) alternative is to round mid-point values up or down randomly. Easier for a computer to do than when data processing with pencil and paper, of course. The random method is slightly better in that it does not rely (as the rule does) on an even division of values between odd and even intervals.
 

Andy873

Member
Joined
23 Mar 2017
Messages
965
Thanks everyone for your input on this.

As I've said before, Rose Grove West Junction height is illusive, I've tried before to calculate its height but due to the lack of BM's and spot heights I can't find a decent reference point except railway bridge No. 56.

The 1890's map shows a road next to the Leeds & Liverpool canal with a spot height of 425 feet. Would it be reasonable to assume the canal would be say 5 feet lower? giving 420 feet... On the basis that water doesn't flow uphill, then the canal altitude under bridge No. 56 would be as said, 420 feet.

My calculations coming up from Padiham to the junction gets me to around 440 feet. A BM at nearby Rose Grove goods shed shows 453 feet, if we take off waist height to ground level we get to around 450. Now that leaves an altitude gap of 10 feet.

If I could find out the canal altitude under the bridge, and its height clearance I would be closer to a figure, but apart from Network Rail, who would know these details?

I've tried again this morning to find out the canal bridge data, but all I get is location, bridge number, no canal altitude for that specific point or height clearance.

The link shows the canal and bridge with an 8F crossing over it:


I can't remember just how tall an 8F was, maybe 12 feet, and it looks like you could have stacked two on top of each other giving a height of around 24 to 25 feet. If so, that would take the track level to be around 445 feet - help anyone please?
 

Morayshire

Member
Joined
6 Feb 2019
Messages
125
The value 277 from an 1890's map means that location point is 277 feet above Newlyn Harbour.
Liverpool not Newlyn datum in 1890 surely?

Newlyn wasn't set up until the early 1910's and it can make a difference to the levels.

Also, if you are in coal mining country, then the OS benchmarks may also be showing changes in level due to subsidence.

One of the things I do like about my day job is that we get some leeway to go down rabbit holes like this.
 

Ploughman

Established Member
Joined
15 Jan 2010
Messages
2,892
Location
Near where the 3 ridings meet
I had a look around and yes, one has .48 and one has .50?? Looking at modern examples the initial value is meters and after the dot it's milometers, but these 1890's map are imperial measurements. There's only 12 inches per foot so it can't be inches, what else could it be?
Could it be a Link in a chain? I thought these were nearer 9" than 8 though.
 

zwk500

Veteran Member
Joined
20 Jan 2020
Messages
13,425
Location
Bristol
Would it be reasonable to assume the canal would be say 5 feet lower? giving 420 feet... On the basis that water doesn't flow uphill, then the canal altitude under bridge No. 56 would be as said, 420 feet.
Canals between Locks will be flat, so if you can follow the line across to a contour or other defined altitude feature you will know what the height of the canal is.
if we take off waist height to ground level we get to around 450. Now that leaves an altitude gap of 10 feet.
Are you sure that because the Benchmark is marked above the ground, the value given isn't still the actual ground level? Also beware of which part of the canal you are defining the altitude for - the towpath is obviously higher than the waterline, and the centre of the channel will be a few feet below the waterline.
If I could find out the canal altitude under the bridge, and its height clearance I would be closer to a figure, but apart from Network Rail, who would know these details?
You can try the Canal and Waterways Trust https://canalrivertrust.org.uk/canals-and-rivers/leeds-and-liverpool-canal. I would be surprised if NR knew the altitude of that bridge.
 

John Webb

Established Member
Joined
5 Jun 2010
Messages
3,076
Location
St Albans
.....Are you sure that because the Benchmark is marked above the ground, the value given isn't still the actual ground level?.......
The horizontal line of the benchmark is at the declared level - or at least it is the declared level when the measurement was made. As Morayshire mentions above in post #15 it is possible in some areas for levels to change due to subsidence.
 

Springs Branch

Established Member
Joined
7 Nov 2013
Messages
1,431
Location
Where my keyboard has no £ key
I found this website with a huge number of photographs from the 1950s, of Ordnance Survey people taking photos of spot heights around Manchester,
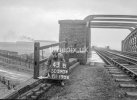
Should be little doubt about the elevation of the railway at this benchmark ...
WestwoodPark640.jpg
Source: Veronica B. at Wigan World Album.

Why did I come up with this particular one?
The lower-level line with the goods wagons is the ex-LNWR 'Springs Branch'.
 
Last edited:

Andy873

Member
Joined
23 Mar 2017
Messages
965
Thanks for all the replies on this again.

Should be little doubt about the elevation of the railway at this benchmark ...
@Springs Branch Thought you might have a gem of a photo regarding the Springs Branch!

The horizontal line of the benchmark is at the declared level - or at least it is the declared level when the measurement was made. As Morayshire mentions above in post #15 it is possible in some areas for levels to change due to subsidence.
Absolutely, I've lost count of how many disused and active mines there were close to my old branch line. It actually suffered over the years because of subsidence from the mine workings.

You can try the Canal and Waterways Trust https://canalrivertrust.org.uk/canals-and-rivers/leeds-and-liverpool-canal. I would be surprised if NR knew the altitude of that bridge.

For queries &c on OS maps and mapping, there is The Charles Close Society for the Study of Ordnance Survey Maps, or you can post questions or join the debate at the Ordnance Maps Discussion Group
Very helpful suggestions, think I will have a go and see what they might know.

Liverpool not Newlyn datum in 1890 surely?

Newlyn wasn't set up until the early 1910's and it can make a difference to the levels.
I was aware the maps said altitudes were taken from Liverpool (sea level), it's just another example of you're never quite sure what you're reading.

With regards to benchmarks - they were of course all over the place. I had the western junction down as 406 feet, but I have just spotted on the original box from the 1892 map, it has a benchmark placed upon it which says 416 right by the junction.

See this map sheet (bottom right hand corner and look for "Harwood Junction" and the signal box:


Looking at these old maps, benchmarks (BM) seem to be placed all around and on railway lines and buildings, and bridges don't escape them either.

This begs another question - Turning up one day and placing a BM on the public side of a station is one thing, but placing them (and spot heights) on bridges at track level is another matter surely? I can also see spot heights along the line itself, again it would have required some co-operation with the railway company?
 

edwin_m

Veteran Member
Joined
21 Apr 2013
Messages
24,935
Location
Nottingham
Should be little doubt about the elevation of the railway at this benchmark ...
View attachment 156476
Source: Veronica B. at Wigan World Album.

Why did I come up with this particular one?
The lower-level line with the goods wagons is the ex-LNWR 'Springs Branch'.
I think these are actually spot heights, which show as a dot on the map but aren't identified on the ground as benchmarks are. Hence, presumably, this photo is kept in the archives in case someone needs to locate it exactly in future. Which may be difficult if the railway has been closed and the bridge demolished in the meantime...
 

Ploughman

Established Member
Joined
15 Jan 2010
Messages
2,892
Location
Near where the 3 ridings meet
Should be little doubt about the elevation of the railway at this benchmark ...
View attachment 156476
Source: Veronica B. at Wigan World Album.

Why did I come up with this particular one?
The lower-level line with the goods wagons is the ex-LNWR 'Springs Branch'.
I would have thought that the Benchmark should be placed on a point unlikely to be Moved or Displaced.
The level in the photo shows a fencepost, which could easily be dislodged when more railings are added, or misread by reading on the slope.
A more secure feature would be a chiseled mark in the brick bridge abutment.
 

stuving

Member
Joined
26 Jan 2017
Messages
267
I think these are actually spot heights, which show as a dot on the map but aren't identified on the ground as benchmarks are. Hence, presumably, this photo is kept in the archives in case someone needs to locate it exactly in future. Which may be difficult if the railway has been closed and the bridge demolished in the meantime...
They are neither! OS explains these record photographs thus:
OS surveyors took revision point (RP) photos across Britain to provide a network of surveyed locations. These known spots could then be used to ‘control’ the position of detail on a large scale map. RPs were often on corners of buildings and other immovable features, and were fixed to centimetre accuracy. Finding the RPs for future map updates was an issue, and photography quickly became the best visual reference – leading to thousands of photos of men with white arrows…

Many of these RP photo albums have since been destroyed, although collections do remain for Croydon, Liverpool and Taunton, amongst others. The Manchester collection is exceptional, both for its size, there are over 45,000 photos in total, and the survival of the negatives. As better quality images can be created from negatives, Timepix focused on this collection for their launch.
So these were basically intermediate points used in local surveying, especially in urban areas where you could often not see other surveyed points. Surveying required that you could see at least two points that were already fixed by survey from outside, or to measure a distance straight and level along a sightline.

I have seen some of these photos before, but not explored the Timepix site (which is paid-for).
 

edwin_m

Veteran Member
Joined
21 Apr 2013
Messages
24,935
Location
Nottingham
They are neither! OS explains these record photographs thus:

So these were basically intermediate points used in local surveying, especially in urban areas where you could often not see other surveyed points. Surveying required that you could see at least two points that were already fixed by survey from outside, or to measure a distance straight and level along a sightline.

I have seen some of these photos before, but not explored the Timepix site (which is paid-for).
Thanks for this. I believe Timepix is free to browse - I certainly did so extensively while trying to find various scenes from where I was brought up - but you can pay to get prints.
 

Andy873

Member
Joined
23 Mar 2017
Messages
965
I decided to test out Google Earth's altitude details...

I know at the west Blackburn end the junction was at 416 feet, which is also shown on a bench mark on the original signal box. At the location that was the junction, Google Earth does indeed place the height at 416.

Moving back to the other eastern end junction (that was) it gives a height of 425 and the railway bridge at 427.

My calculations put the 1 in 40 incline's summit at 437, 437-425 = a 12 foot drop down to the junction. The other point is this bank has always been stated at a length of 1.25 miles, how accurate that length is, is anyone's guess. If it was actually shorter, the gap would be less.

Could John Marshall's gradients profile for the branch be wrong?

EDIT - I believe I've found the answer to all of this.

My book about the branch says
"Coming off the main line a wooden sign next to the first over bridge stating goods trains must stop and pin down brakes". "From this bridge the line started its 1.25 decent down to Padiham at 1 in 40".

Meaning the decent was 1.25 miles, not the whole 1 in 40.

This first over bridge was 443 yards from the junction, that's very close to a quarter of a mile. If we count how many 40's are in 440 we get 11. This 11 is very close to the 12 foot difference!

This decent shallowed out to a 1 in 90 before running level. Think I'm going to have to re-draw the gradients profile.

Conclusion to all of this - The text in the book is rather ambiguous and open to being read wrongly which I have done for a long time now.

Does this sound correct to you?
 
Last edited:

DelW

Established Member
Joined
15 Jan 2015
Messages
3,889
Could it be a Link in a chain? I thought these were nearer 9" than 8 though.

AFAIK links (and chains) were only ever used for horizontal measurements, not vertical.

For reference, 1 chain = 22 yards = 66 feet = 100 links. Therefore 1link = 66 x 12 ÷ 100 = 7.92 inches.
 

Andy873

Member
Joined
23 Mar 2017
Messages
965
How accurate are John Marshall's gradient profiles?

John's gradient profile moving west from Great Harwood station goes up hill at 1 in 196, then 1 in 90, then to the summit at 1 in 200.

Now I get the summit to around 430 feet.

From this summit continuing west you go down hill for around 1.5 miles split more or less equally between a 1 in 59 and a 1 in 64.

My calculations puts the western junction somewhere around 388, but I know it was 416??

Do I have to assume these gradient profiles were more like an artist's impression? Stuart Taylor also describes part of this line differently?
 

DelW

Established Member
Joined
15 Jan 2015
Messages
3,889
How accurate are John Marshall's gradient profiles?

John's gradient profile moving west from Great Harwood station goes up hill at 1 in 196, then 1 in 90, then to the summit at 1 in 200.

Now I get the summit to around 430 feet.

From this summit continuing west you go down hill for around 1.5 miles split more or less equally between a 1 in 59 and a 1 in 64.

My calculations puts the western junction somewhere around 388, but I know it was 416??

Do I have to assume these gradient profiles were more like an artist's impression? Stuart Taylor also describes part of this line differently?
I suspect that gradient profiles are really an idealised version of a more complicated situation on the ground. All the profiles I've ever seen show straight lines between angular change-of-grade points. Even if a line could be built like that, it would be most uncomfortable to travel over.

In reality, there will be a vertical transition curve at each change of grade. In modern computer-calculated road alignments, such curves follow precise mathematical equations, and the lengths and levels along the curve are calculated to millimetre accuracy. But when railways were built, I imagine the surveyors just set out the main gradients, and the transitions were probably eyed-in during tracklaying.

When there are long straight grades, like the Lickey, those curves wouldn't have too much effect, but where a line has multiple changes of grade in a short distance, the cumulative effect could be that actual ground levels AOD might end up rather different from values calculated from gradient profiles.
 

Top