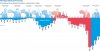
Thanks for that graph - tells the story in a nutshell that Brown's borrowing was nothing out of the ordinary until 2008-09 when the government had to bail out the banks to save the economy (and the country).
One other point worth noting is that the graph appears to show the monetary value of the deficit. But the important figure is what the deficit is as a % of GDP. If the graph was corrected for that, it would show relatively higher deficits the further back in time you go. By not correcting for that, the graph shows the deficits during the Thatcher/Major years as being smaller than they actually are in real terms, relative to deficits in more recent years.
--- old post above --- --- new post below ---
You are aware though, that when Osborne first came to power the interest payments alone were an eye watering £49Bn. That's a lot of money before you start paying off the intital debt itself isn't it?
Anyway here is a lovely graph
£49BN
seems eye-watering, but the situation is actually a lot more complicated than that. I don't know the figures, but much of that interest will be being paid to organizations within the UK - and that money therefore immediately re-enters the flow of money within the British economy, boosting economic growth, and of course much of that is very quickly returned to the Government in the form of extra tax revenue.
If the Government somehow magically paid off its entire debt, then financial situation would improve, but NOT by anything like that £49bn, because those benefits to the economy from the debt repayments would disappear, reducing the Government's income. And a consequence of this is that the actual loss to the Government that results from repayments of accumulated debt is going to be much less than the raw figures would suggest. (I don't know by how much though)
")