TGV
Member
Has anyone here done this kind of thing (see image below).
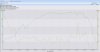
It's a trace from a GPS data logger showing position overlaid on google maps with data taken every 5 seconds on location, speed, altitude etc...
The map speaks for itself, the red flag was the position of max speed (100.4mph) and the graph on the bottom right shows speed vs. time over the journey.
The device is very accurate - I've logged car journeys with it and it accurately shows detail down to what LANE on the motorway I was in!!! The speed is way more accurate than the speedo in the car and using a calculation for average speed it is approx 99.1% accurate to theoretical - good enough for my use. And according to OS maps the altitude is spot on - even if it's the one thing that occasionally shows an error, but that seems to be dependant on how many satellites are fixing your position.
Anyway, it works great on trains too - logged this journey tonight. Thought it might be interesting to some.


")